Please, support PV!
It allows to keep PV going, with more focus towards AI, but keeping be one of the few truly independent places.
It allows to keep PV going, with more focus towards AI, but keeping be one of the few truly independent places.
GH2 Hack Technical Tests
-
@Cbrandin
Could you do the same test with 720P? It would be interesting to see if we get different results with 720p(ie: without B frames).
Outstanding test. Keep up the great work.
-
yes.
constant qp is value for p frames.
i frames goes plus minus 2 and b frames plus 2 .
something like that?
-
@mpgxsvcd
I could, but it takes a lot of time to do there tests. I just did this test to prove, objectively, that quality does indeed improve with 1080p. I chose that because the 1080p rendering is already so good that the difference is less obvious than with every other mode. Running more tests seems like gilding the lily.
Lower QP (higher AQ) will always improve quality - that's the very purpose of it and the AVCHD standard states that unambiguously. I just wanted to prove it empirically for the skeptics. I think I have done that. At this point I think it's reasonable (ridiculous not to, actually) assume that the GH2 codec behaves like it is supposed to when quality is raised. If it behaved any differently in another mode, like 720p - well... that would be truly bizarre.
I'd rather focus on other things now - like loop filter adjustments and film modes, for example.
Chris -
>I'd rather focus on other things now - like loop filter adjustments and film modes, for example.
Good idea :-)
-
@vladnik
Yup. Although sometimes P frames also get QP+2. The most common pattern I've seen with real world subjects is I=QP-2 to QP+2, P=QP, B=QP+2. The base QP appears to be decided at the beginning of each GOP and can vary according to image characteristics (motion, light changes, etc...). The QP setting in PTool determines what the lowest value can be - and you'll see that commonly reached with highly detailed static subjects.
Chris -
-
@vladnik
Yeah, the GH2 codec is actually quite impressive. We aren't "fixing" anything that sucks otherwise, it's all gravy.
Chris -
@cbrandin Thanks for showing us how to do such technical tests. I'm sure some of us who can't bear to find out more stuffs would test out more cases :)
-
@Cbrandin
Totally understood. Yes you have certainly proven what you set out to. What would we need in order to do this test ourselves?
-
I made an animated GIF of the histogram (blown up 400%)

 histo.gif1018 x 393 - 132K
 -
Sorry, wasn't sure how to embed.
-
@mpgxsvcd Print out the testchart, take video clips, extract frames, import into photoshop or lightroom, and capture the histogram chart? Not sure if editing tools like Premiere Pro has a histogram.
-
Capture (make sure exposure is exaclty right) - import to editor (I use Vegas), export frame in lossless format (like PNG, not JPG). Import frame to Photoshop. Set levels to 0-31 (approximately, to spread out shadow details). At this point the image will look terrible. Use Photoshop's histogram tool. The chart you use should have a mix of detail stuff (like resolution targets) and (this is important) gradients. The GH2 camera outperforms most (if not all) printers, so you will see a quantization artifacts that are actually caused by the printer.
It's not an easy test...
Chris -
@Hallvalla
Very Nice! Thanks.
@stonebat
The chart I attached is just a thumbnail, so it won't work. The actual chart file is big (15MB+). It has to be printed using absolute colormetric color management settings and with a very good printer (I used an Epson 4800 with the Colorbyte RIP). If you want, I'll upload the file to you. No way it will work with most people's email.
I have a resolution chart as well, if anybody is interested - it's even bigger: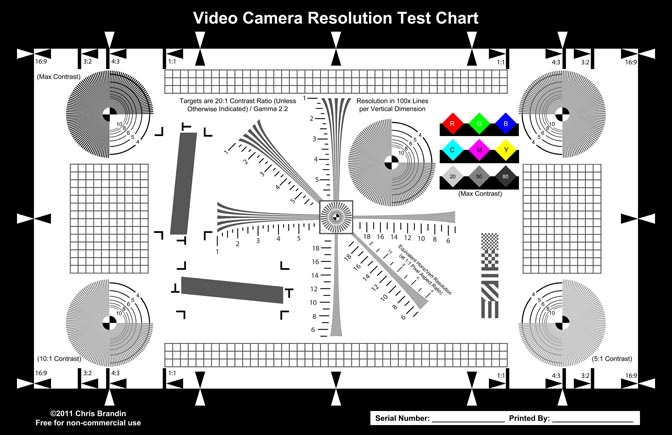
I have 48-bit super high-res version Photoshop files too, but they are 300-400MB each.
Chris ChartThumb1.jpg672 x 435 - 93K
 -
The 66M sure does push the data to the left a little bit, couldn't really tell until it was blown up. I'd like to see 88+ on this histogram to see if it makes even more of a difference.
Thanks for posting those histograms, sure makes more sense to me displayed that way.
-
Note that Photoshop auto-scales the histogram. Although the peaks look the same size, they're not - they are actually lower for the high bitrate settings.
Chris -
@Cbrandin
I just pm'd you links to upload the original files if you want me to share them with everyone? -
@cbrandin
How about small app that could load png, set levels and plot unscaled histogram, and in the case of multiple files, plot 3D waterfall also?
May be we'll find someone who'll be able to make it? -
-
Thanks Chris, this is really fascinating. If I can hazard to draw a comparison from audio, which I know better than video, there is a lot of gear which tests better but does not necessarily sound better. Of course that is subjective, and what you are doing is to do a controlled test, but I would still like to see some real world footage. And here, I think--again, trying to be systematic--ideally the footage would take the form of an internet poll, where it is unlabelled, you vote, then see the result. If I understand what you are saying, part of the value lies in how far you can "push" the video in post, and it might be nice to see some examples of that. Thanks again for all your work.
Also it seems like 44m may be a kind of sweet spot--looking at the animated chart it seems like a few of the artifacts (e.g., the line on the far left) increase in places, if I'm reading it right. The sweet spot is interesting for me because I would like to identify a setting that increases quality but also file-spans reliably. Or just gives the best file space to IQ ratio. Based on your tests I will probably go for that setting, and live with the camera for a while--thanks for giving me a good starting place. -
@DrDave
Sounds like a good idea. I wonder how many people will actually produce the same shot using two different settings, though. It's not so easy, lighting, etc... can change from minute to minute.
I like the idea of processed footage - some of the biggest advantages of hacking only show up in an environment that includes post processing. What might not be visible in unprocessed footage might become very visible in processed footage. Relatively invisible latitude, for example, could become very visible when you make use of it.
Chris -
Files only span under 32mbit (approx.) in 3.62. I think the sweet spot is somewhere between 44mbit and 66mbit from what I have seen so far. We need to do more testing with this!
-
I should point out that charts can never manifest subtleties like real world subjects. I used a chart because I wanted to be totally in control of everything. I suspect the difference in the histograms with real world subjects may be even more striking. Gradients, for example, are extremely hard to do with charts because in that regard cameras tend to outperform printers. Testing with real world subjects, containing both detail and gradients would also be useful - harder to control, though.
Chris -
Has anybody not had the spanning problem? How much has this been tested? Have different people with different cards tested this? I just want to be sure it isn't a problem with one persons card or camera, etc...
Chris -
I've had the spanning problem on 3.62 with anything over about 32mbs. Also in 3.61 on 50 mbps shooting.


Start New Topic


Howdy, Stranger!
It looks like you're new here. If you want to get involved, click one of these buttons!
Categories
- Topics List23,993
- Blog5,725
- General and News1,354
- Hacks and Patches1,153
- ↳ Top Settings33
- ↳ Beginners256
- ↳ Archives402
- ↳ Hacks News and Development56
- Cameras2,368
- ↳ Panasonic995
- ↳ Canon118
- ↳ Sony156
- ↳ Nikon96
- ↳ Pentax and Samsung70
- ↳ Olympus and Fujifilm102
- ↳ Compacts and Camcorders300
- ↳ Smartphones for video97
- ↳ Pro Video Cameras191
- ↳ BlackMagic and other raw cameras116
- Skill1,960
- ↳ Business and distribution66
- ↳ Preparation, scripts and legal38
- ↳ Art149
- ↳ Import, Convert, Exporting291
- ↳ Editors191
- ↳ Effects and stunts115
- ↳ Color grading197
- ↳ Sound and Music280
- ↳ Lighting96
- ↳ Software and storage tips266
- Gear5,420
- ↳ Filters, Adapters, Matte boxes344
- ↳ Lenses1,582
- ↳ Follow focus and gears93
- ↳ Sound499
- ↳ Lighting gear314
- ↳ Camera movement230
- ↳ Gimbals and copters302
- ↳ Rigs and related stuff273
- ↳ Power solutions83
- ↳ Monitors and viewfinders340
- ↳ Tripods and fluid heads139
- ↳ Storage286
- ↳ Computers and studio gear560
- ↳ VR and 3D248
- Showcase1,859
- Marketplace2,834
- Offtopic1,320


