It allows to keep PV going, with more focus towards AI, but keeping be one of the few truly independent places.
-
The cumulative increase in global crude oil (Crude + Condensate) production, in the seven year period from 1998 to 2005, in excess of what we would have produced at the 1998 production rate of 67.0 mbpd (million barrels per day, EIA), was 6.3 Gb (billion barrels).
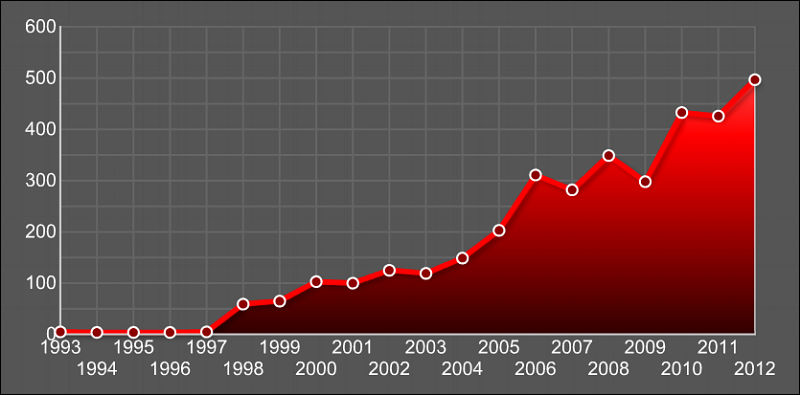
Steven Kopits estimated that cumulative global upstream (oil exploration and production) capital costs were $1.5 Trillion in the seven year period from 1998 to 2005. So, the total capital cost per net cumulative barrel of increase in production from 1998 to 2005 (relative to 1998) was about $300 per barrel.
Of course, the total upstream capital expenditures were used to both offset declines from existing production and to show a net increase in production, but I am primarily interested in the difference between the 1998 to 2005 increase in global crude oil production versus the 2005 to 2012 increase in global crude oil production.
The cumulative increase in global crude oil production, in the seven year period from 2005 to 2012, in excess of what we would have produced at the 2005 production rate of 73.6 mbpd (million barrels per day, EIA), was 0.3 Gb.
Steven Kopits estimated that cumulative global upstream capital costs were $3.5 Trillion in the seven year period from 2005 to 2012. So, the total capital cost per net cumulative barrel of increase in production from 2005 to 2012 (relative to 2005) was about $11,700 per barrel.
Note that cumulative upstream capital costs increased by 133% from the 1998 to 2005 time period to the 2005 to 2012 time period, but the corresponding increase in cumulative production (relative to 1998 and 2005 respectively) fell by 95%.
Therefore the global upstream capital costs necessary to offset production declines from existing wells and to add one new barrel of cumulative production in the 2005 to 2012 time period was 39 times what was necessary to offset production declines from existing wells and to add one new barrel of cumulative production in the 1998 to 2005 time period--in terms of capital costs per barrel of new cumulative production.
And note that annual Brent crude oil prices rose at an average rate of about 15%/year from 1998 to 2012.
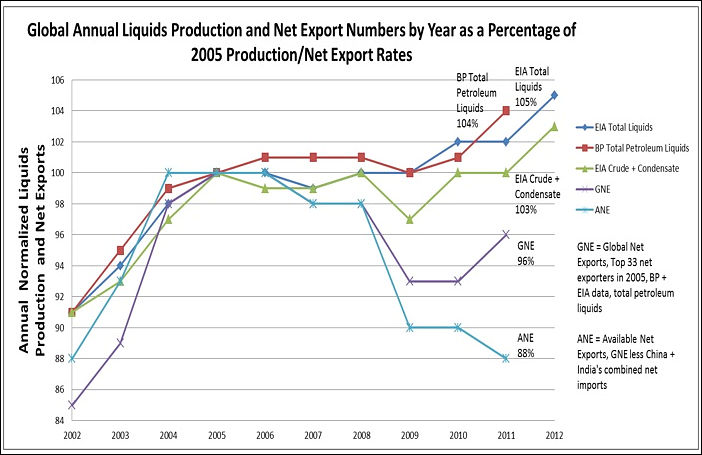
We have seen a material post-2005 decline in Global Net Exports of oil (GNE - Combined net exports from (2005) Top 33 net oil exporters, total petroleum liquids + other liquids (EIA)), with developing countries, led by China, so far at least consuming an increasing share of a post-2005 declining volume of GNE.
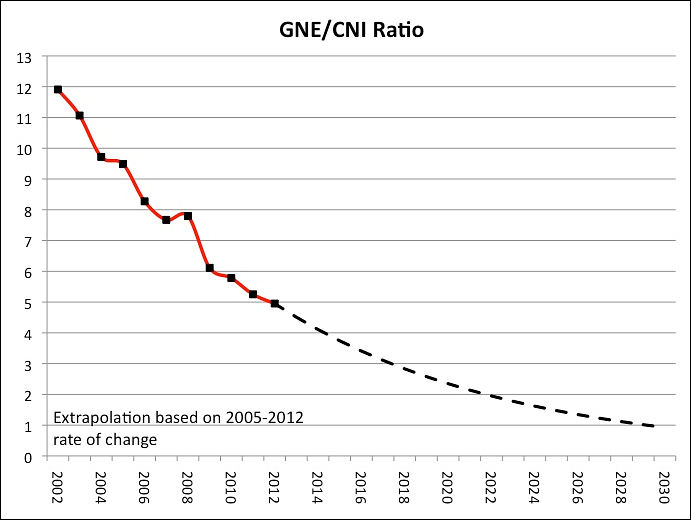
The reality facing the US and most other developed net oil importing countries is that are gradually being priced out of the global market for exported oil, via price rationing. At the 2005 to 2012 rate of decline in the ratio of GNE to Chindia’s Net Imports (GNI), the GNE/CNI ratio would approach 1.0 in only 17 years, which implies that the Chindia region alone would theoretically consume 100% of Global Net Exports of oil:

Actual oil available on market is falling, and it is especially bad if you count in China and India consumption

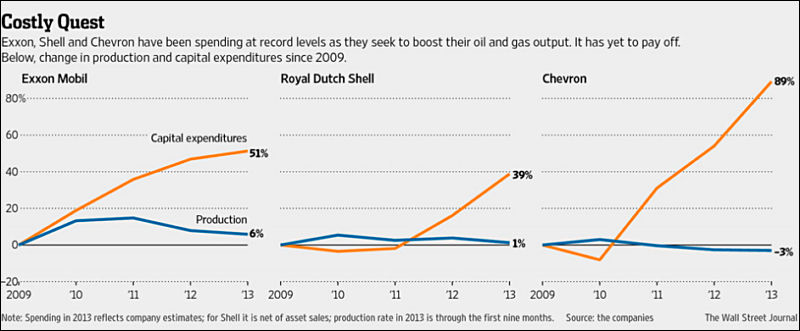
Via http://www.econbrowser.com/archives/2013/11/lower_gasoline.html

 lens6.jpg691 x 520 - 47K
 lens7.jpg702 x 455 - 62K
Howdy, Stranger!
It looks like you're new here. If you want to get involved, click one of these buttons!
Categories
- Topics List23,993
- Blog5,725
- General and News1,354
- Hacks and Patches1,153
- ↳ Top Settings33
- ↳ Beginners256
- ↳ Archives402
- ↳ Hacks News and Development56
- Cameras2,368
- ↳ Panasonic995
- ↳ Canon118
- ↳ Sony156
- ↳ Nikon96
- ↳ Pentax and Samsung70
- ↳ Olympus and Fujifilm102
- ↳ Compacts and Camcorders300
- ↳ Smartphones for video97
- ↳ Pro Video Cameras191
- ↳ BlackMagic and other raw cameras116
- Skill1,960
- ↳ Business and distribution66
- ↳ Preparation, scripts and legal38
- ↳ Art149
- ↳ Import, Convert, Exporting291
- ↳ Editors191
- ↳ Effects and stunts115
- ↳ Color grading197
- ↳ Sound and Music280
- ↳ Lighting96
- ↳ Software and storage tips266
- Gear5,420
- ↳ Filters, Adapters, Matte boxes344
- ↳ Lenses1,582
- ↳ Follow focus and gears93
- ↳ Sound499
- ↳ Lighting gear314
- ↳ Camera movement230
- ↳ Gimbals and copters302
- ↳ Rigs and related stuff273
- ↳ Power solutions83
- ↳ Monitors and viewfinders340
- ↳ Tripods and fluid heads139
- ↳ Storage286
- ↳ Computers and studio gear560
- ↳ VR and 3D248
- Showcase1,859
- Marketplace2,834
- Offtopic1,320


